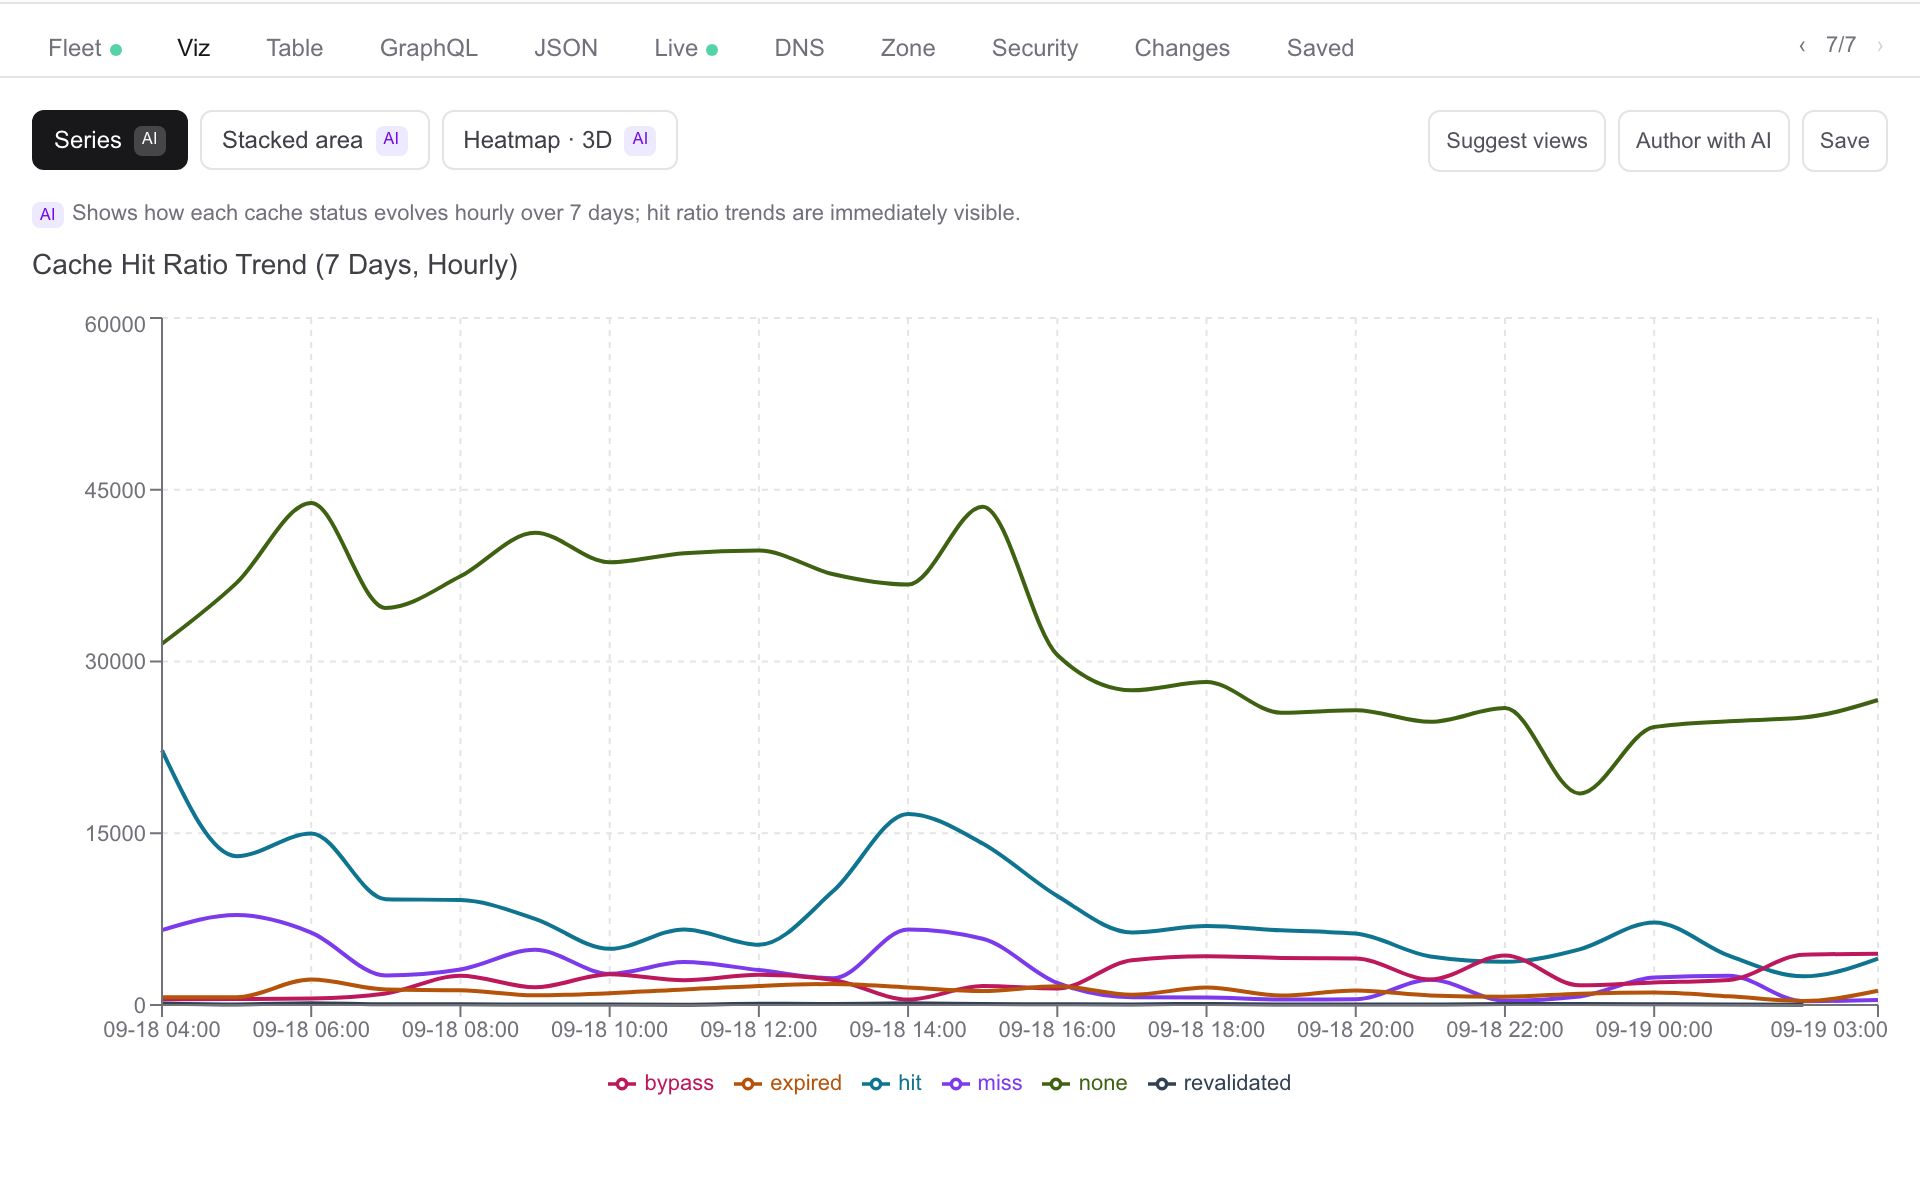
Edge to origin, in one chart.
Cache status by path on plans that expose it, origin latency by hour, which data centre served which region — asked for in plain language and answered from Cloudflare’s own analytics, with the exact query one tab away from the chart.
Who Network engineers, cloud and infrastructure engineers
What gets in the way
- Cache misses you can see in the bill but not on a chart
- “Slow in Germany” with no way to say which PoP or which path
- Edge settings buried deep in the dashboard, one zone at a time
What Zonesteward does about it
- Cache and origin, charted
Nineteen chart kinds, flat and 3D; origin response time and status, edge TTFB and cache status (on plans that expose it), by path, by hour, by country or data centre (on plans that expose it). See it →
- The live globe
Requests by point of presence in real time, arcs for cache misses reaching the origin, one zone or the fleet. See it →
- Edge settings, read and changed
Tiered Cache, Cache Reserve, Argo, DNSSEC, certificates — read in a sentence; changed only through an approval card with read-back. See it →
Try asking Why is the site slow? · Why is it slow in Germany?
All roles Agencies & MSPs · Security & SOC · Ops & Reliability · Developers · DNS & IT admin · Leadership · Support