Ask a question. Get the right chart.
Every answer that returns data comes with a chart, drawn the moment the result arrives. A model then proposes other views and says why. Here is the path from a sentence to a chart on the dashboard.
- Ask
Ask about a zone in plain language: “cache hit ratio by hour this week”, “5xx by path in the last hour”. The model writes the analytics query, the server runs it against your zone with your own Cloudflare token, and the answer comes back as prose with the data on the canvas beside it.
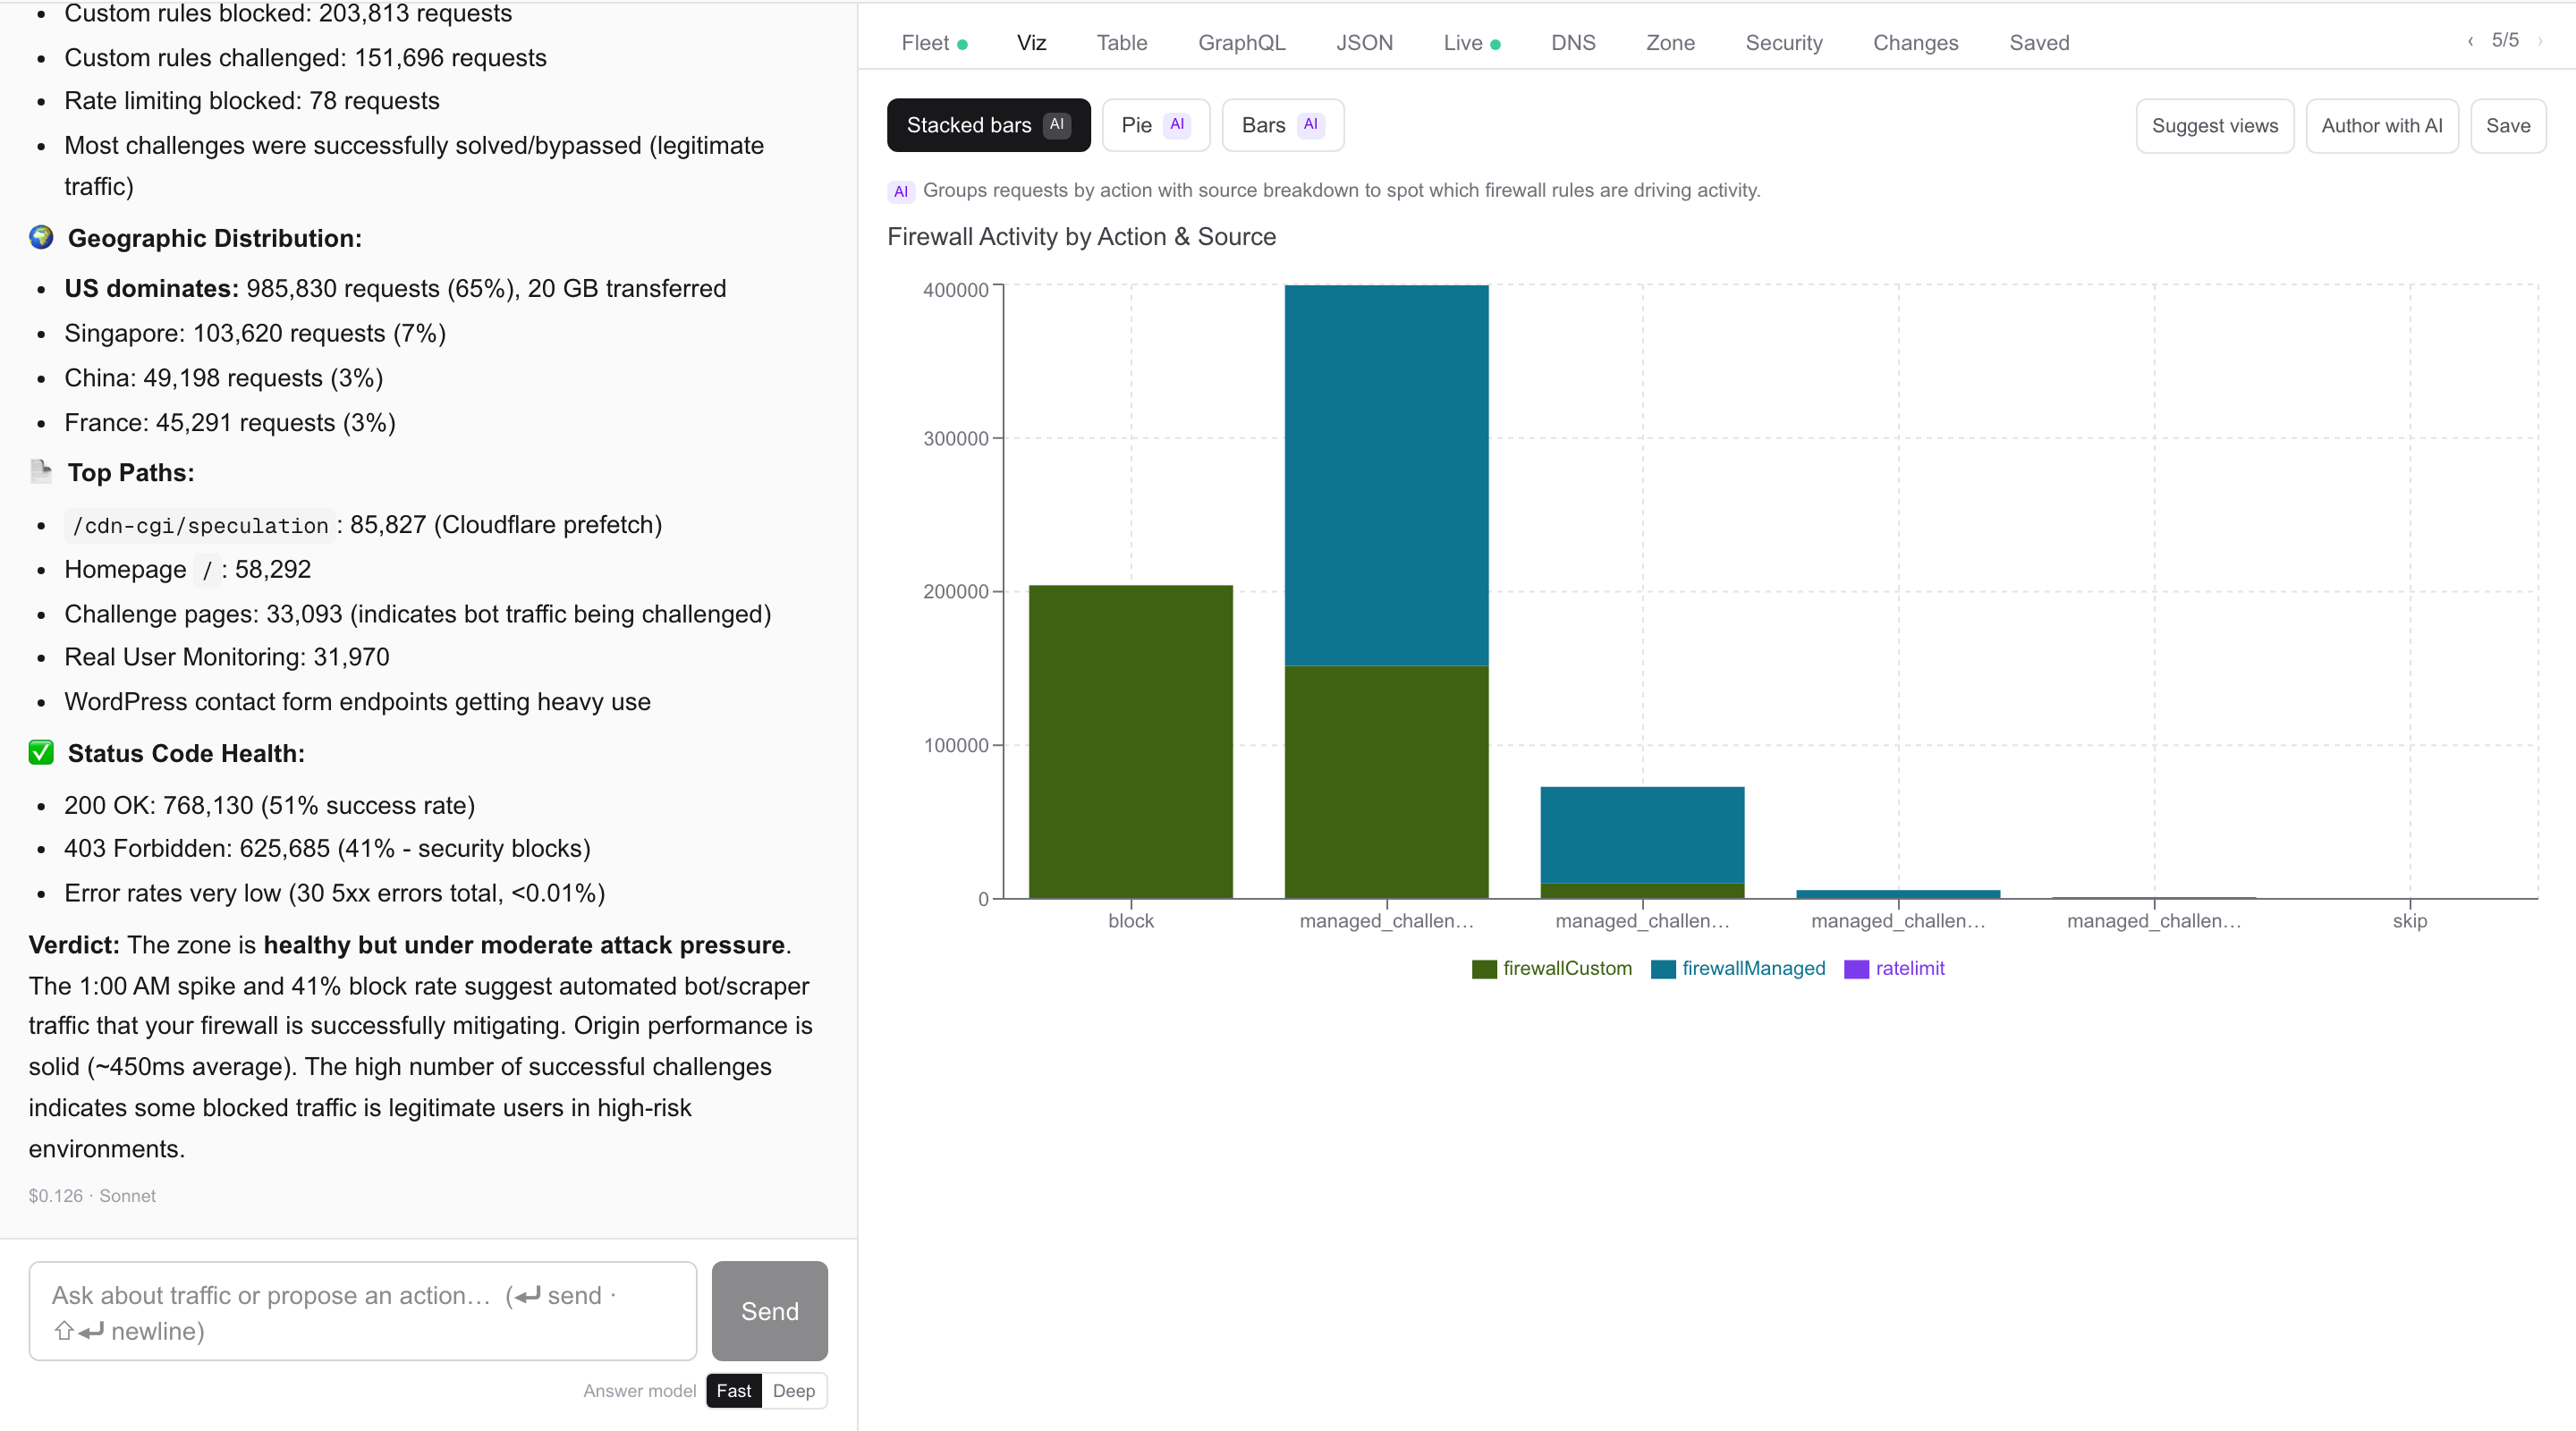
An answer on the left, its chart on the right - An instant chart
The moment the result arrives, the canvas draws a chart chosen from the shape of the data: a single number, a line over time, bars by category, one line per series, or a table. No model is involved in this step, so the chart is there straight away.
Counts are corrected for Cloudflare’s sampling, so the chart shows the same numbers as the written answer.
- Proposed views, with reasons
Then a model looks at a short profile of the result — the field names, what kind of field each is, how many distinct values it has, a few samples — rather than the whole result. It proposes up to four views, each marked AI with a one-line reason for choosing it.
Every proposal is checked against the real data, and a view the data can’t support is never offered. With no model configured, or if it doesn’t answer in time, you get views chosen by rules instead. Suggest views asks for fresh proposals without running the query again.
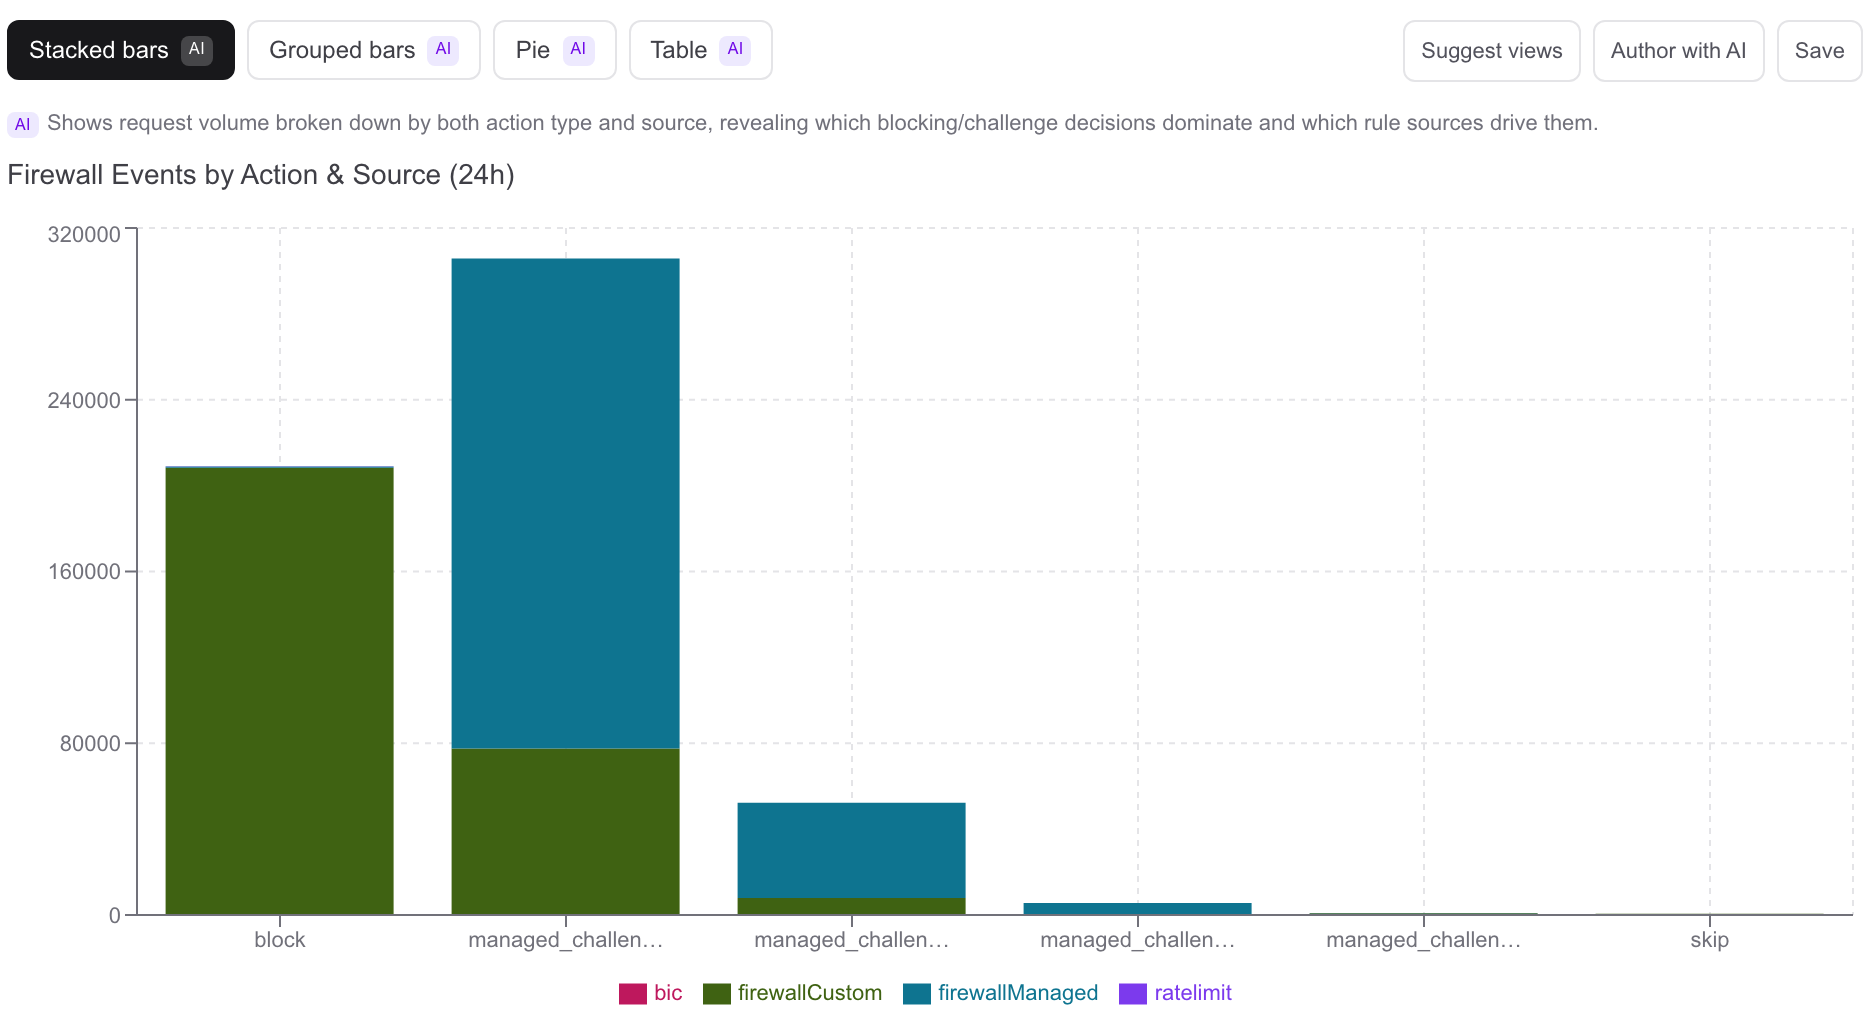
Four proposed views, and the reason for the one on screen - Switch views, flat or 3D
Click any proposal to switch. There are nineteen kinds of chart. The 3D views have a play and scrub control for time and a hover inspector for exact values, and you can move between any 3D views the data fits.
Flat (12). Number, Bars, Line, Area, Series, Table, Scatter, Stacked bars (including 100%), Grouped bars, Stacked area, Pie, Histogram.
3D (7). Timeline, Top-N, Heatmap, Globe, Globe bars, Countries (an extruded map), 3D bars.
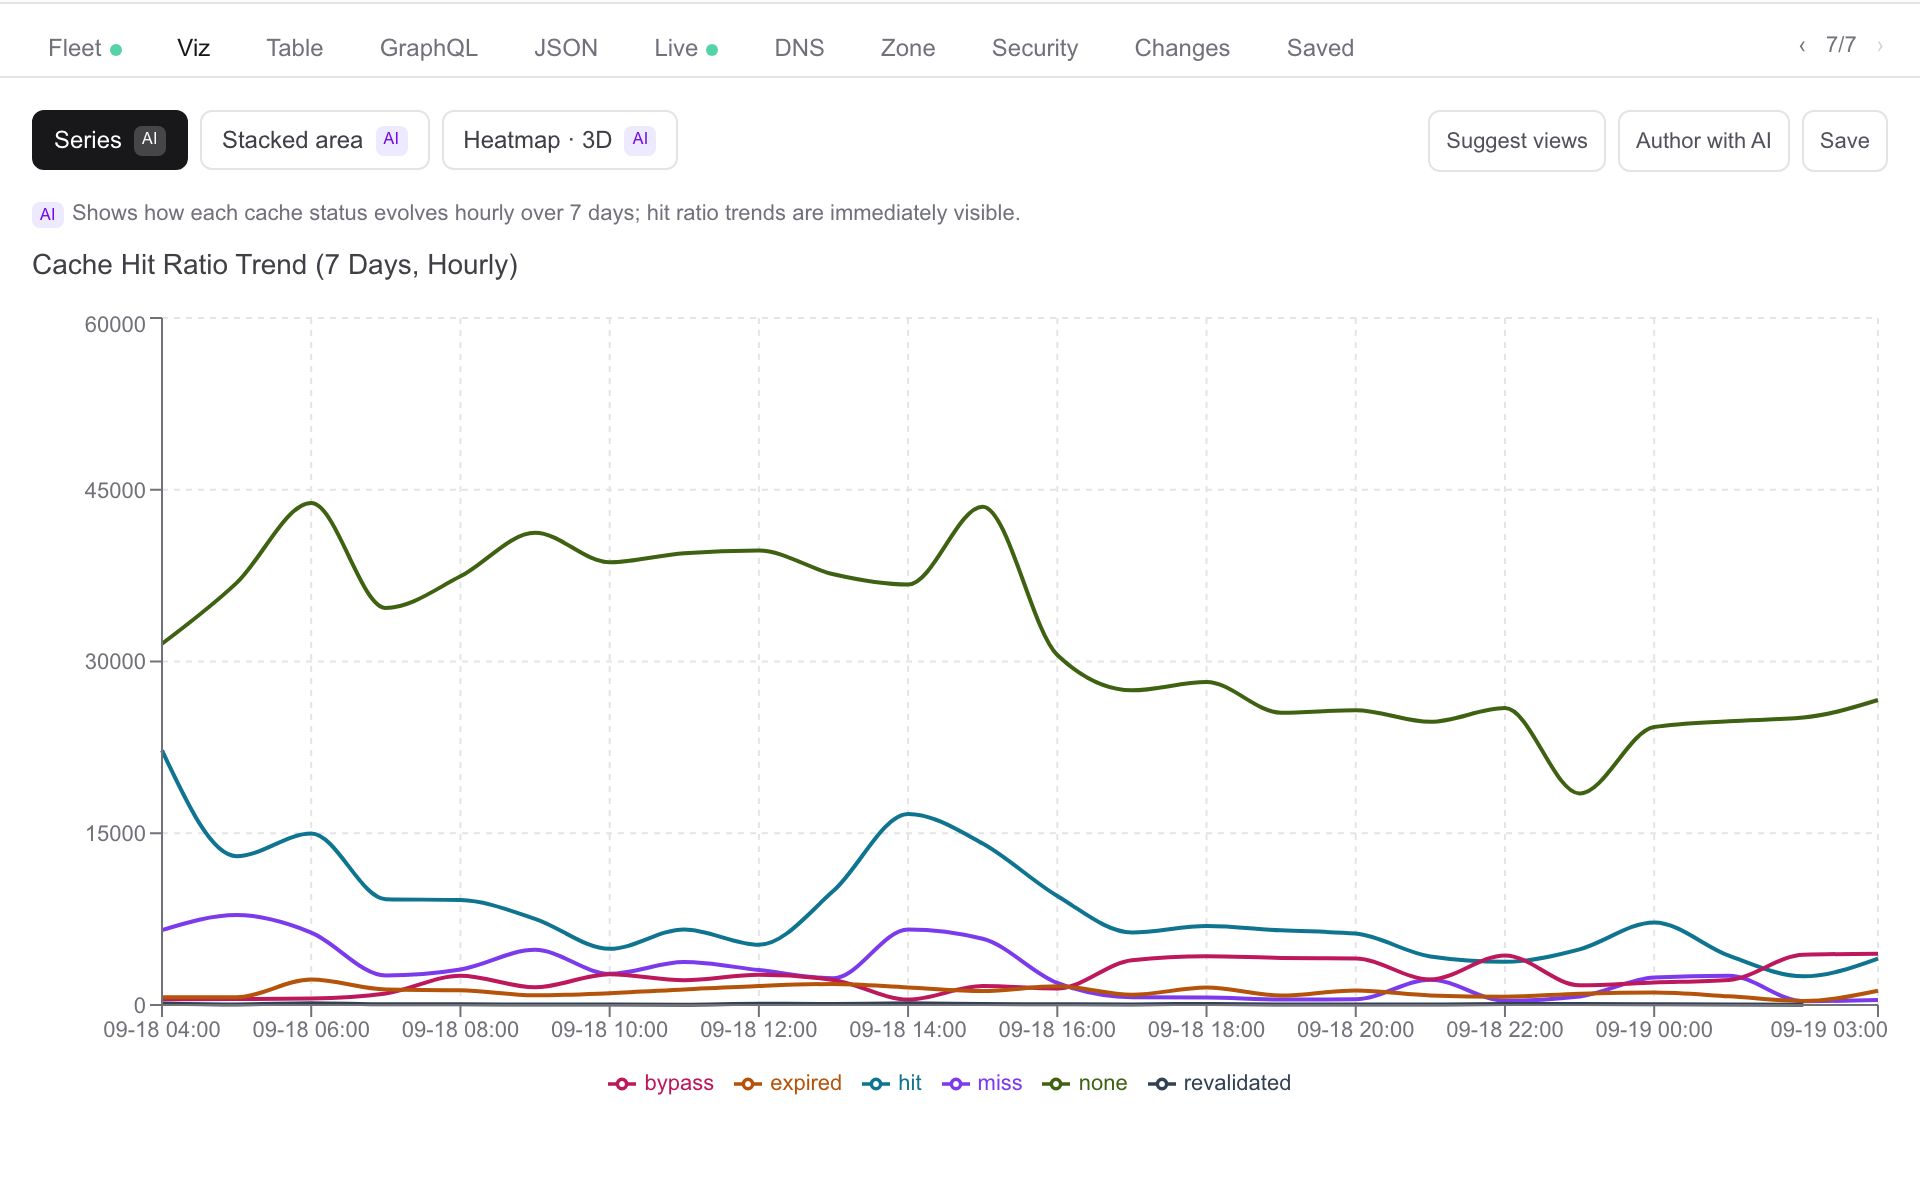
A flat view and a 3D view proposed for the same result - Four tabs beside every answer
Viz is the chart. Table is the rows, with CSV export. GraphQL is the exact query and its variables as they were run, shown for reading rather than editing. JSON is the raw result. The ‹ and › arrows step between earlier results.
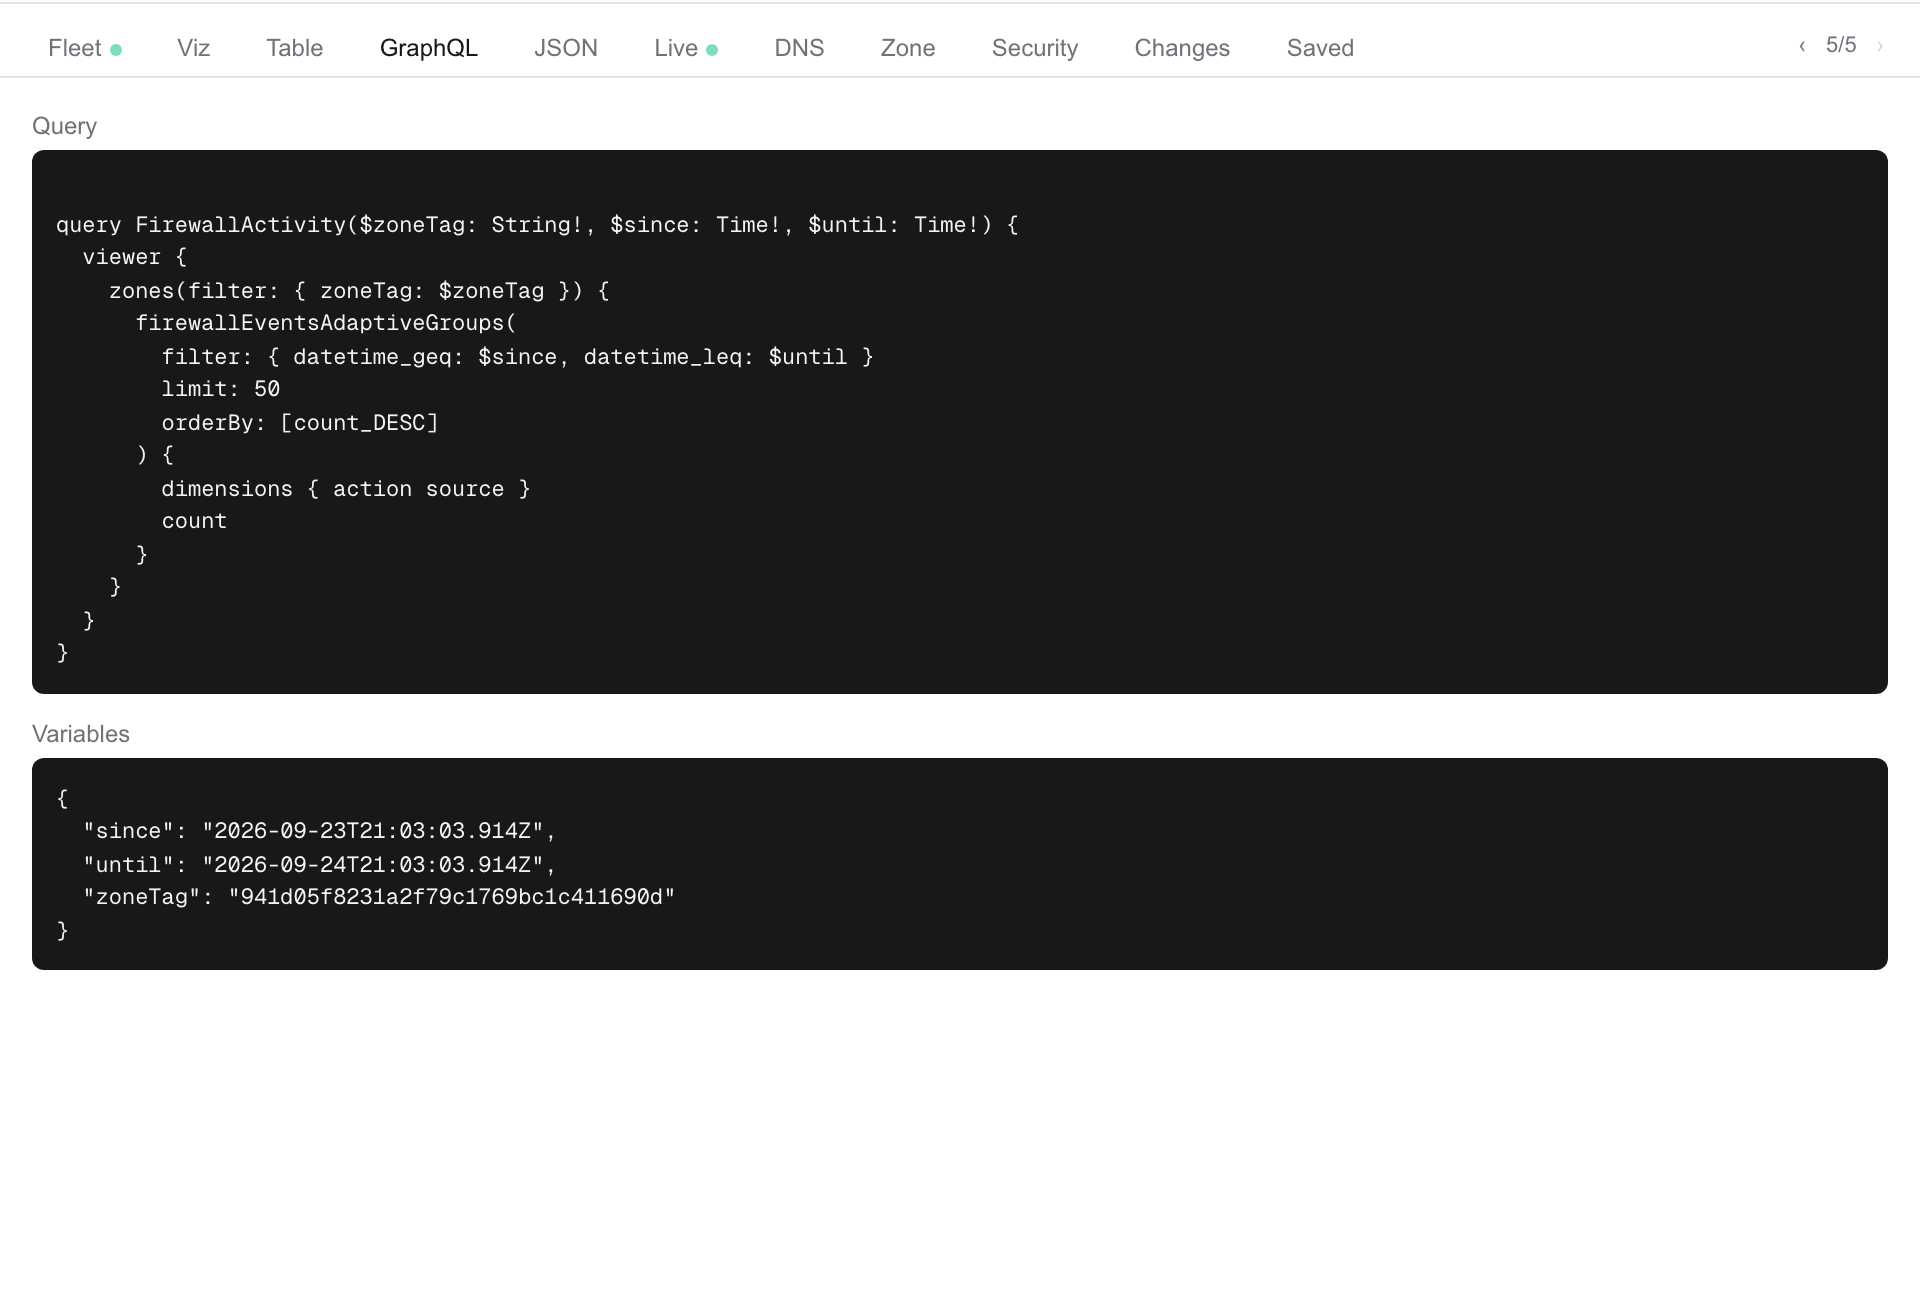
The query and variables, exactly as run - Author with AI
Want a chart the answer didn’t draw? Author with AI, in the Viz tab, takes a sentence: “scatter of p95 origin latency against requests per path, last 24 hours”. It writes the query, dry-runs it against the live zone, checks the chart fits what actually came back, and only then shows a preview with its explanation and the query.
Not quite right? Change the sentence and refine. There is no chart definition to edit by hand; the sentence is how you adjust it.
- Save, pin, and put it on the dashboard
Save names the chart and keeps the conversation it came from, so Open conversation shows why it exists. Tick + dashboard to add it as a widget in the same click.
In the Saved library you can pin a chart so it sorts to the top, delete it, open its conversation, or add it to the dashboard. On the dashboard a chart re-queries every minute and rolls its time window forward, so it stays current, and one widget can combine several sites.
- Safe by design
A chart is a JSON description — which query, which field on which axis, which kind of chart — validated on the server before it is drawn. It is never code, so nothing a model writes runs in your browser. Every query runs with your workspace’s own Cloudflare token.
Chart a question and put it on the dashboard, as a use case — what it checks and what you approve.